Interactive Simulations in Probability, Statistics, Linear Algebra, and Machine Learning
These interactive simulations help visualize fundamental concepts in Probability, Statistics, Linear Algebra, and Machine Learning. Click on any simulation to explore and interact with the concepts in real-time. (Pages are created with the help of AI, including Claude, ChatGPT, and Gemini.)
Probability Theory
Fundamental concepts in probability and statistics

Central Limit Theorem
Explore how the distribution of sample means approaches a normal distribution as sample size increases, regardless of the population distribution.

Monte Carlo π Estimation
Use random sampling to estimate the value of π by simulating random points in a square and counting how many fall within a circle.

Monty-Hall-simulation
In search of a new car, the player chooses a door, say 1. The game host then opens one of the other doors, say 3, to reveal a goat and offers to let the player switch from door 1 to door 2..

Buffons_Needle_Simulation
Experiment with a simulation to get an approximation of Pi by dropping a needle on a lined sheet of paper.

Cauchy_Distribution_demo
The Cauchy distribution is the probability distribution of where a randomly kicked ball lands on a line.

Hypergeometric-urn-experiment
Randomly drawing a sample of items from a finite population without replacement, where the population is categorized into two types (successes and failures), such as colored marbles in an urn.
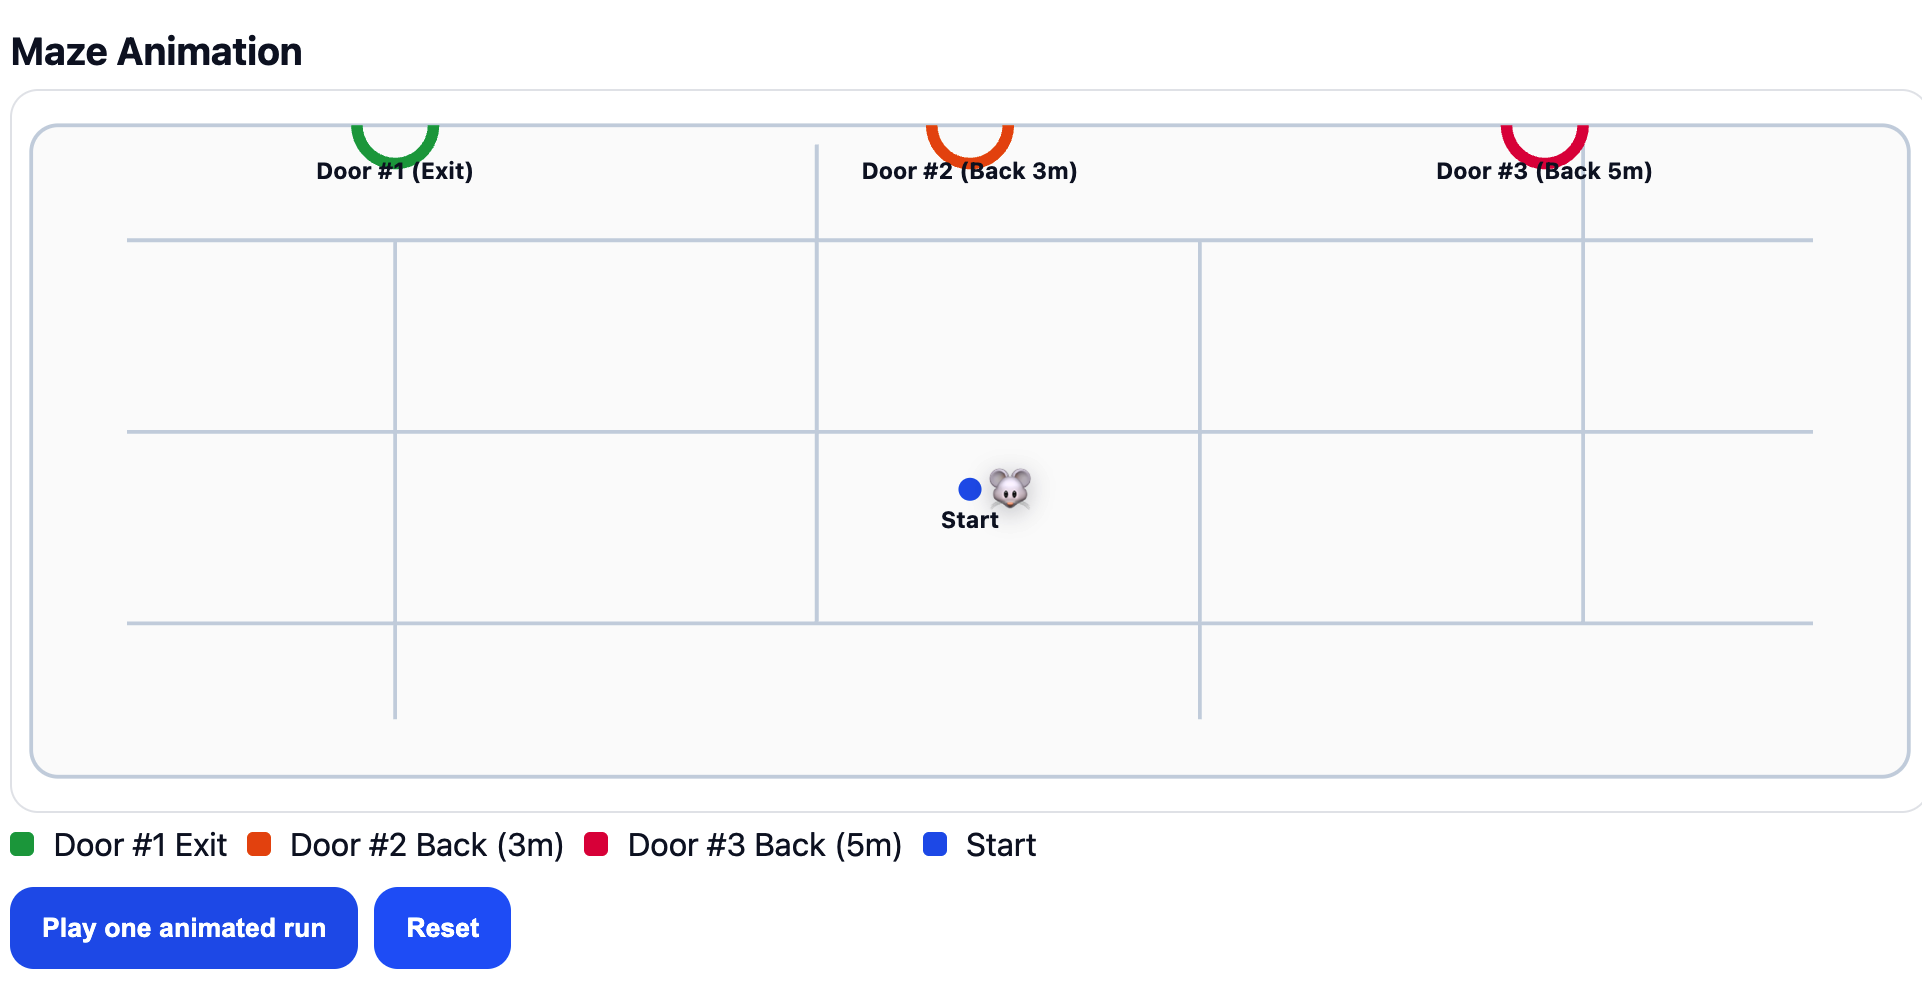
Rat in a maze.
Rat in a maze.

negative_binomial_sim
Models the number of trials needed to achieve a specified number of successes in a series of independent Bernoulli trials

Bayesian Coin Flip
See how Bayesian inference updates our beliefs about a coin's fairness as we observe more flips and gather evidence.
Statistics
Fundamental concepts in statistics

Confidence Interval Simulation
Shows multiple confidence intervals with a vertical line representing the true population mean.
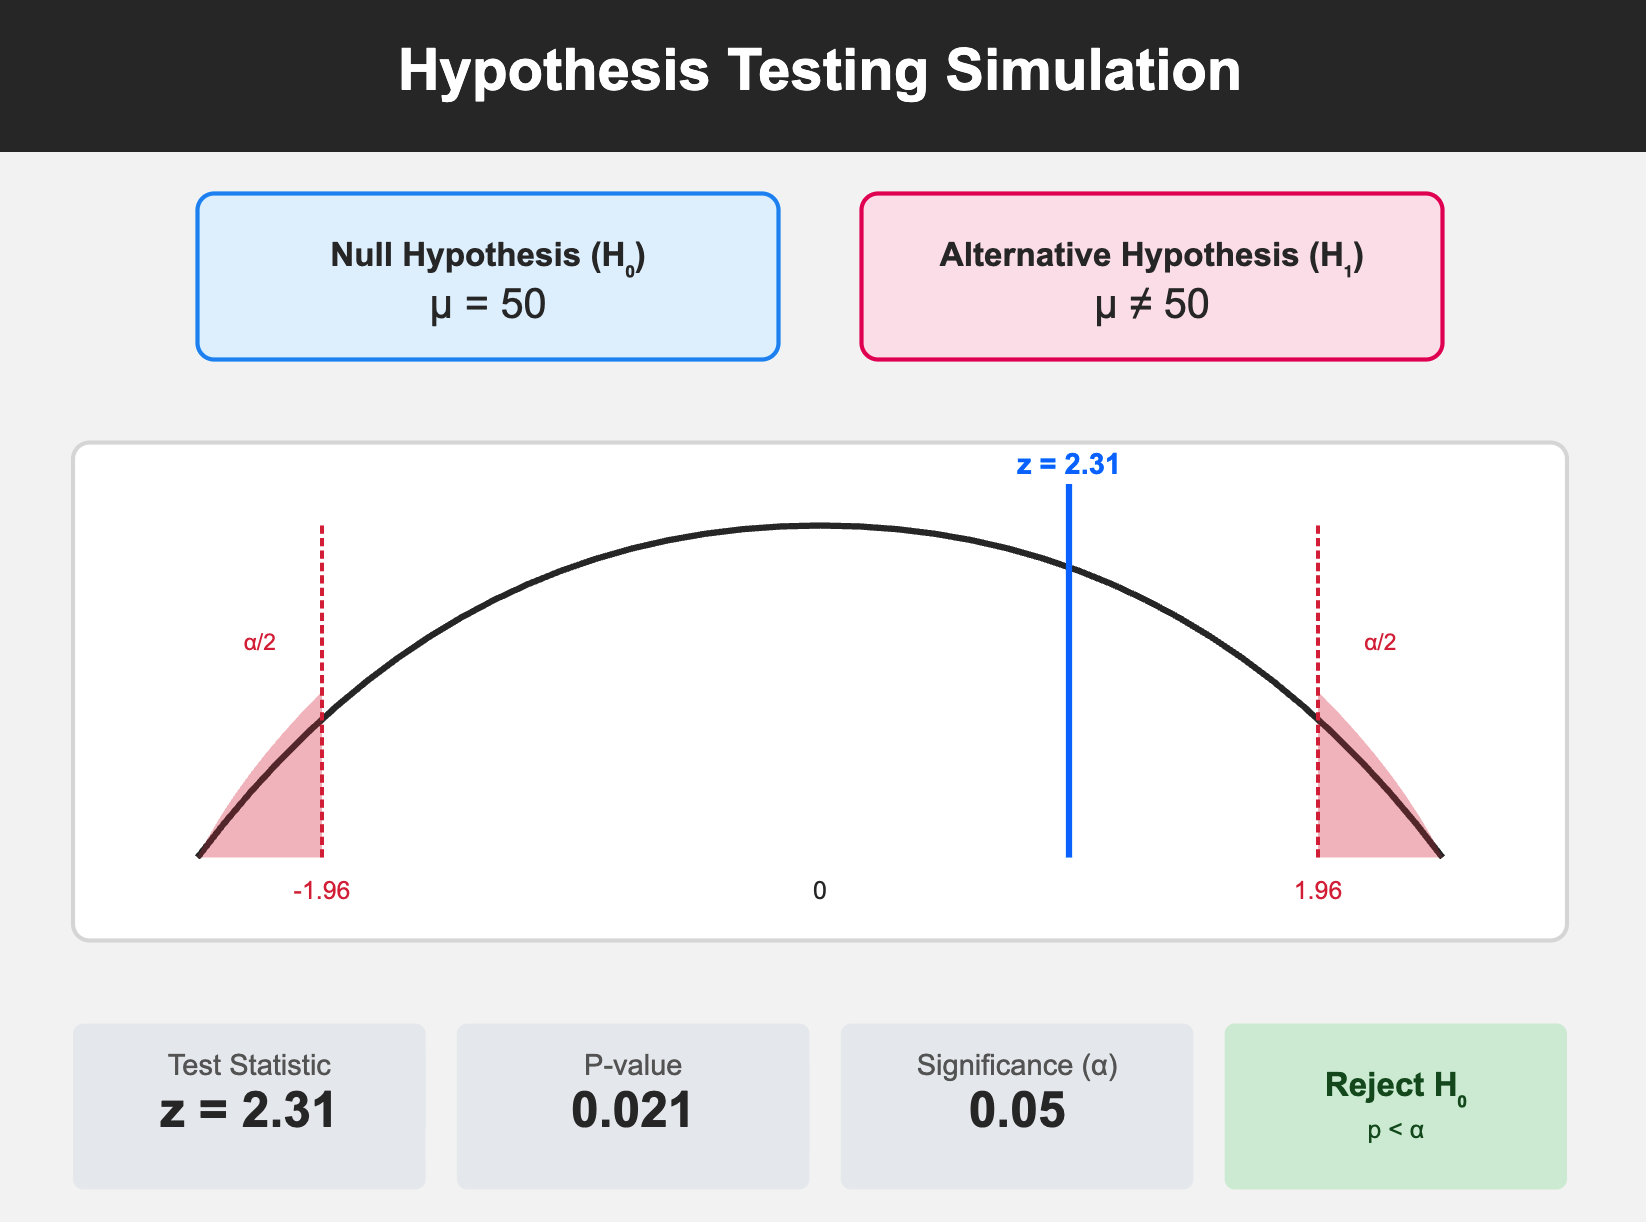
Hypothesis Testing Simulation
Illustrates a normal distribution with shaded critical regions (rejection areas) and a test statistic line

A/B Testing Simulation
Shows side-by-side comparison of Control (A) and Treatment (B) variants with conversion rates, visitor counts, and test results
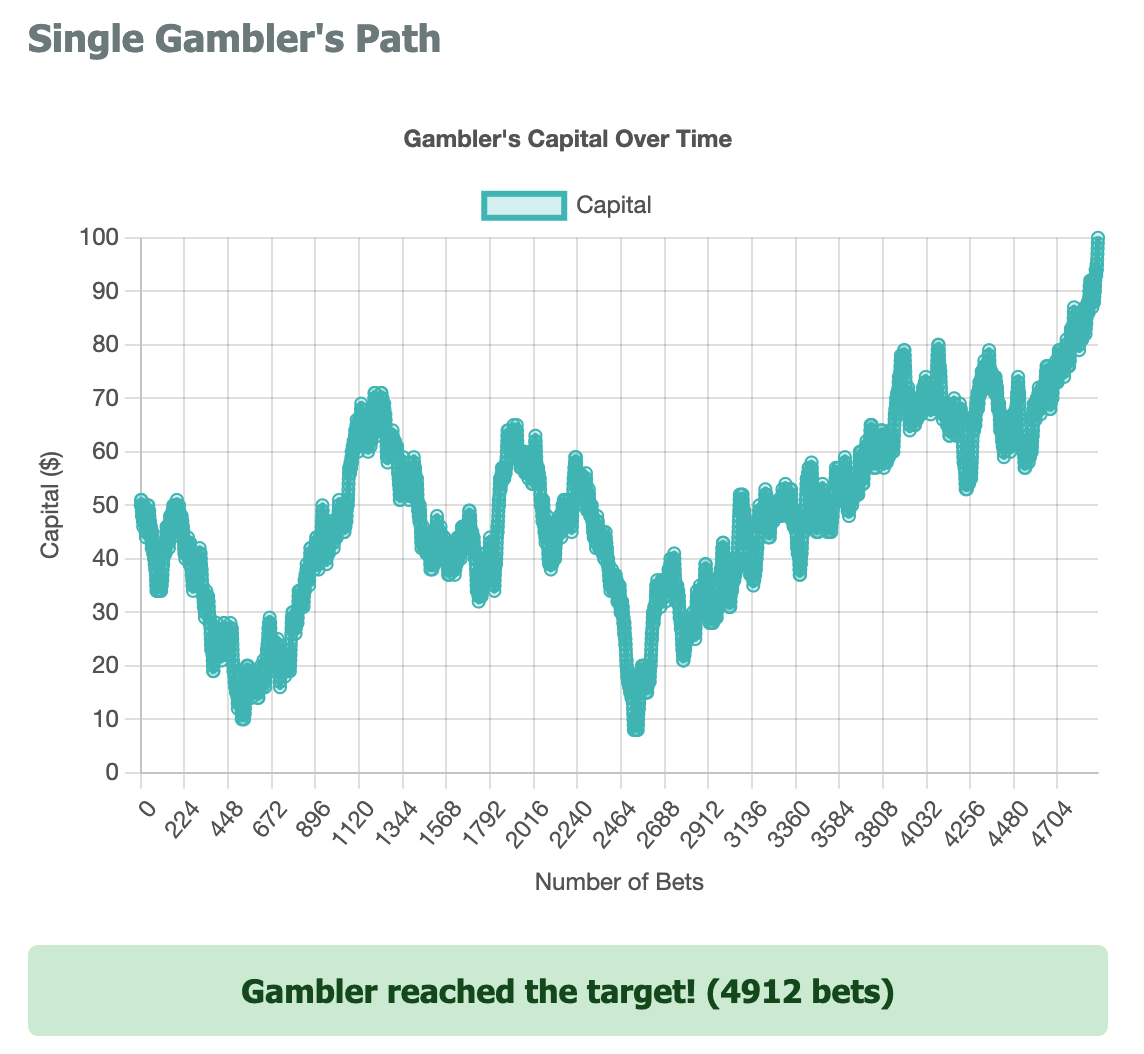
The Gambler's Ruin Problem
The Gambler's Ruin Problem models the situation of a gambler who repeatedly bets in a fair or unfair game until they either go broke (ruin) or reach a target fortune.

ANOVA Simulation 1
Displays four groups with their means and standard deviations, a box plot visualization showing the distribution of each group, and an ANOVA table.
ANOVA Simulation 2
Displays four groups with their means and standard deviations, a box plot visualization showing the distribution of each group, and an ANOVA table.
Linear Algebra
Fundamental concepts in Linear Algebra

Matrix-transformations-2d
Show geometry of different Matrix-Transformations in 2D, including rotation, reflection, projection, etc.
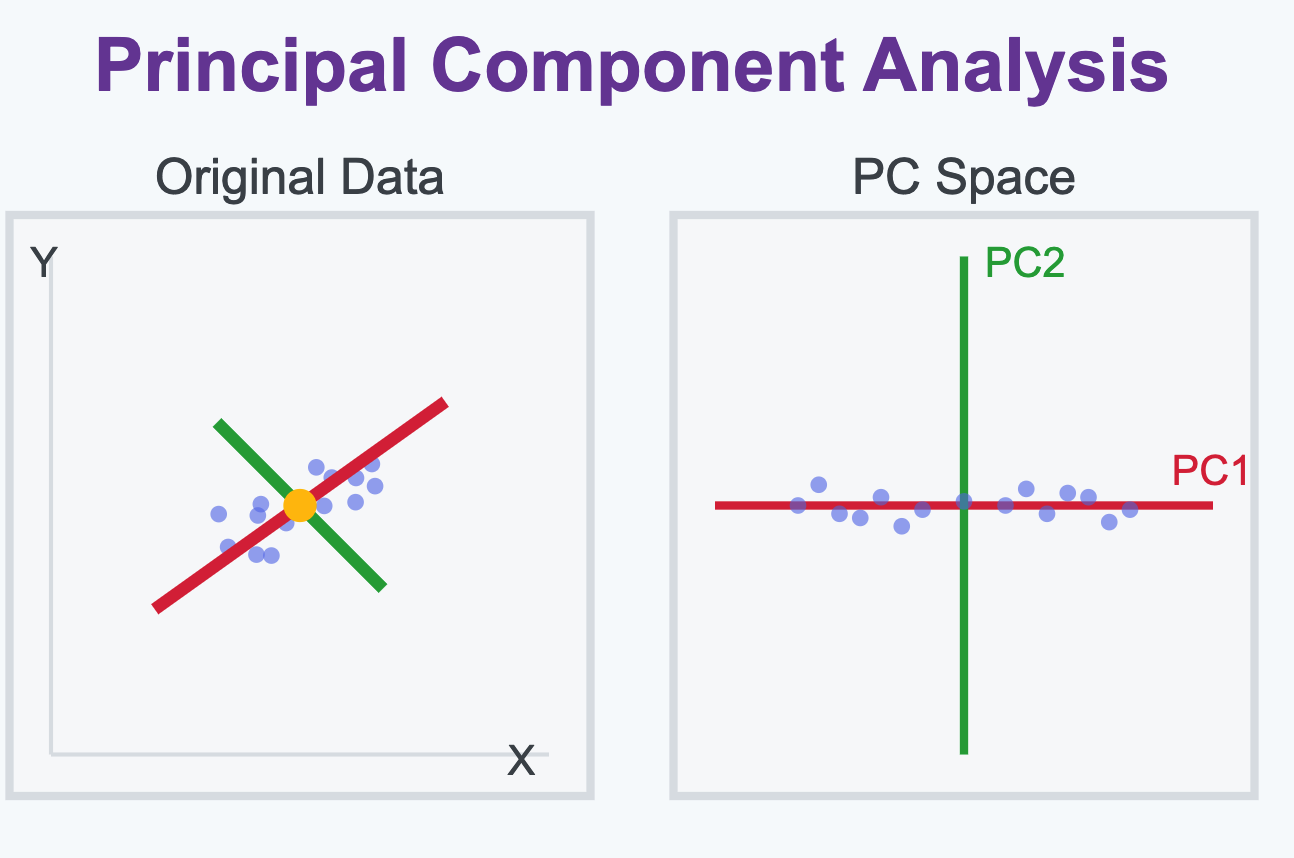
Principal Component Analysis
Interactive 2D data generation with adjustable correlation. Visualizes eigenvectors as principal components.

SVD Image Compression
Displays singular value decay plot with cutoff line.
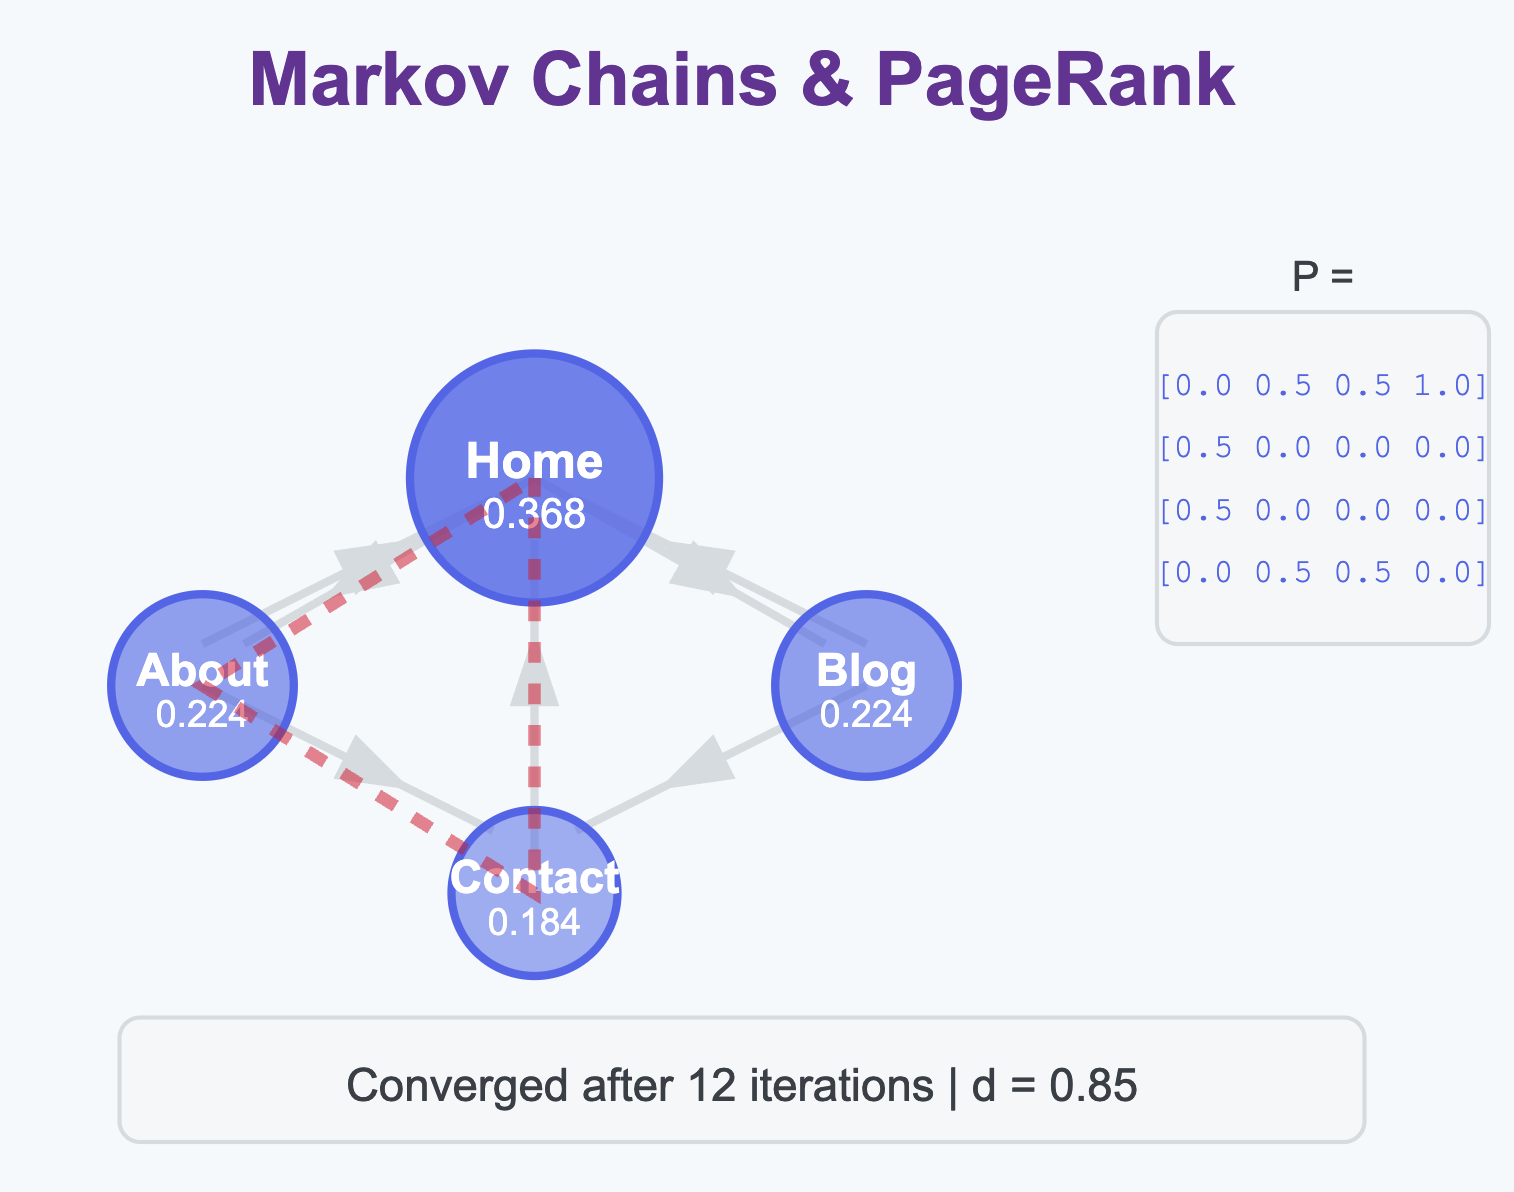
Markov Chains & PageRank Preview
Shows a network graph with nodes sized by PageRank values.
Machine Learning
Core algorithms and concepts visualized

Linear Regression
Visualize how linear regression finds the best-fitting line through noisy data points using least squares optimization.
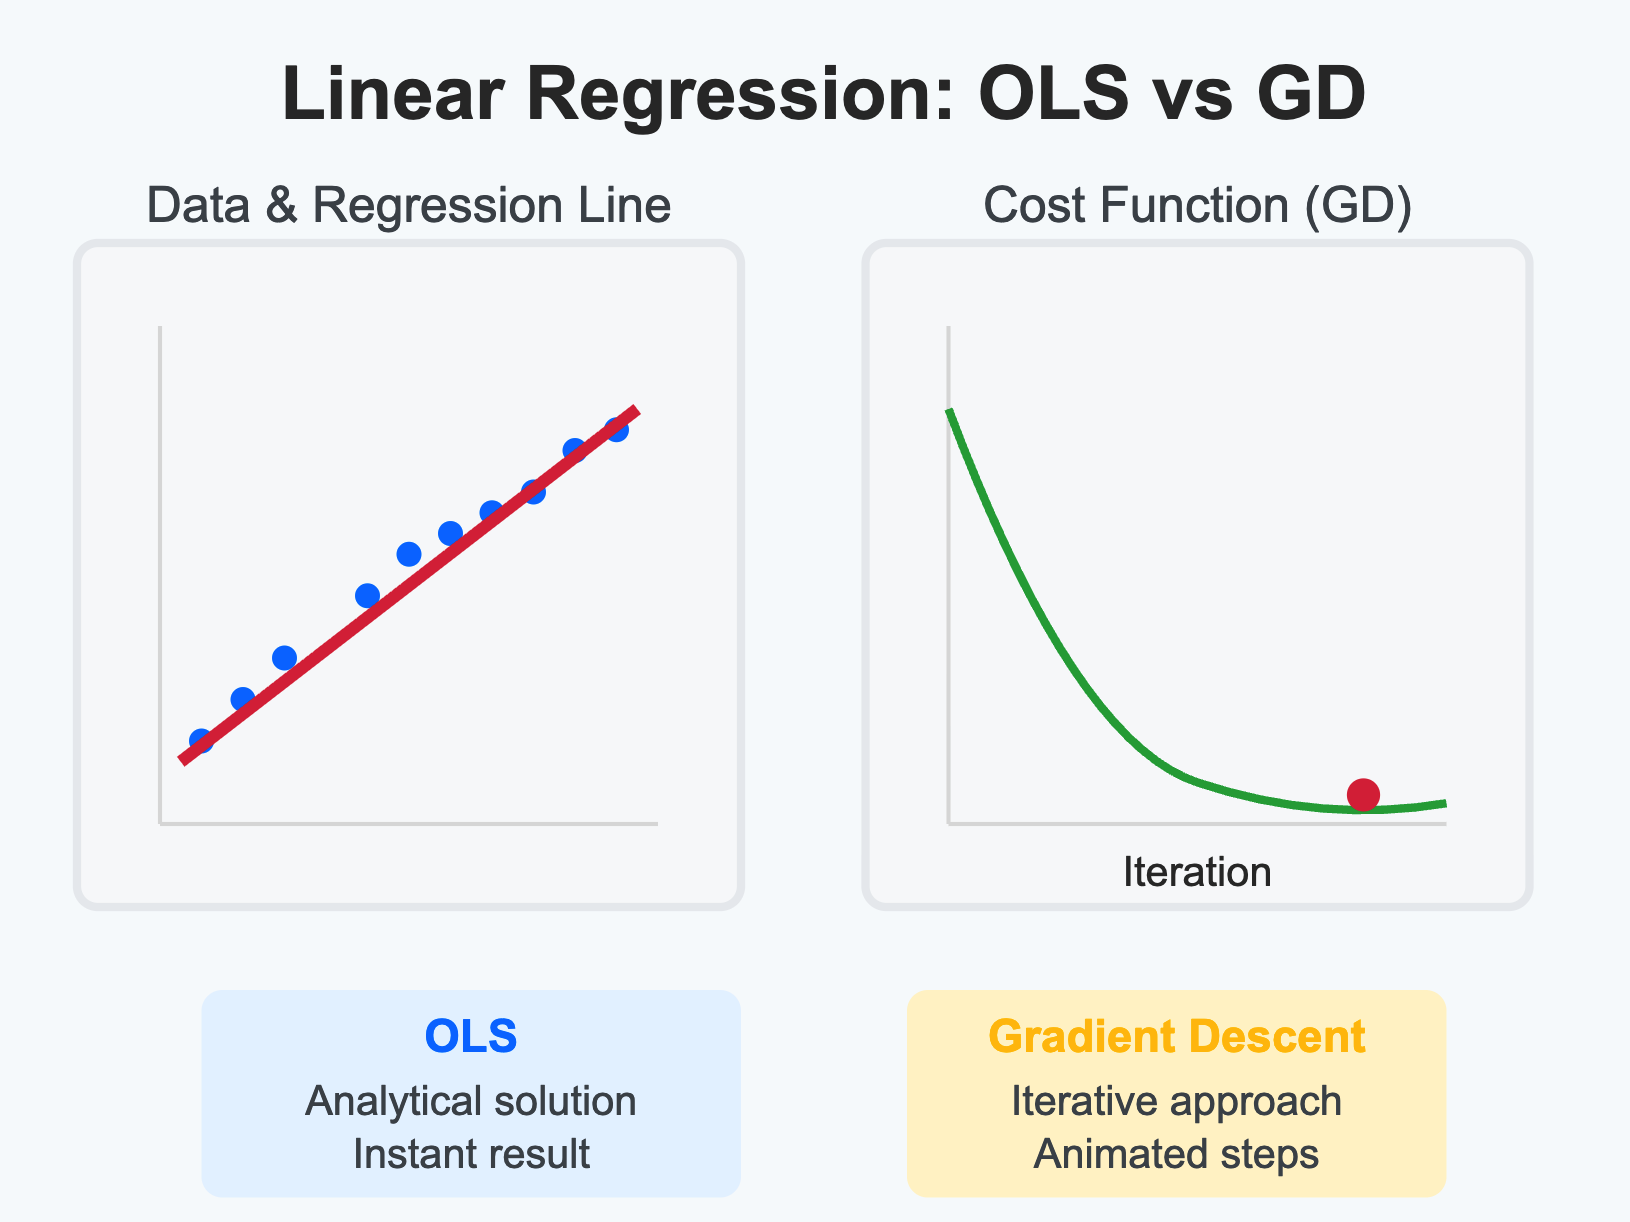
Gradient Descent
Linear regression by Gradient Descent.

K-Means Clustering
Watch the K-means algorithm iteratively find cluster centers and group similar data points together.

Bias_variance_simulation
Demonstrate the bias-variance decomposition.

Neural Network Training
Observe a neural network learn the XOR function through backpropagation and gradient descent.
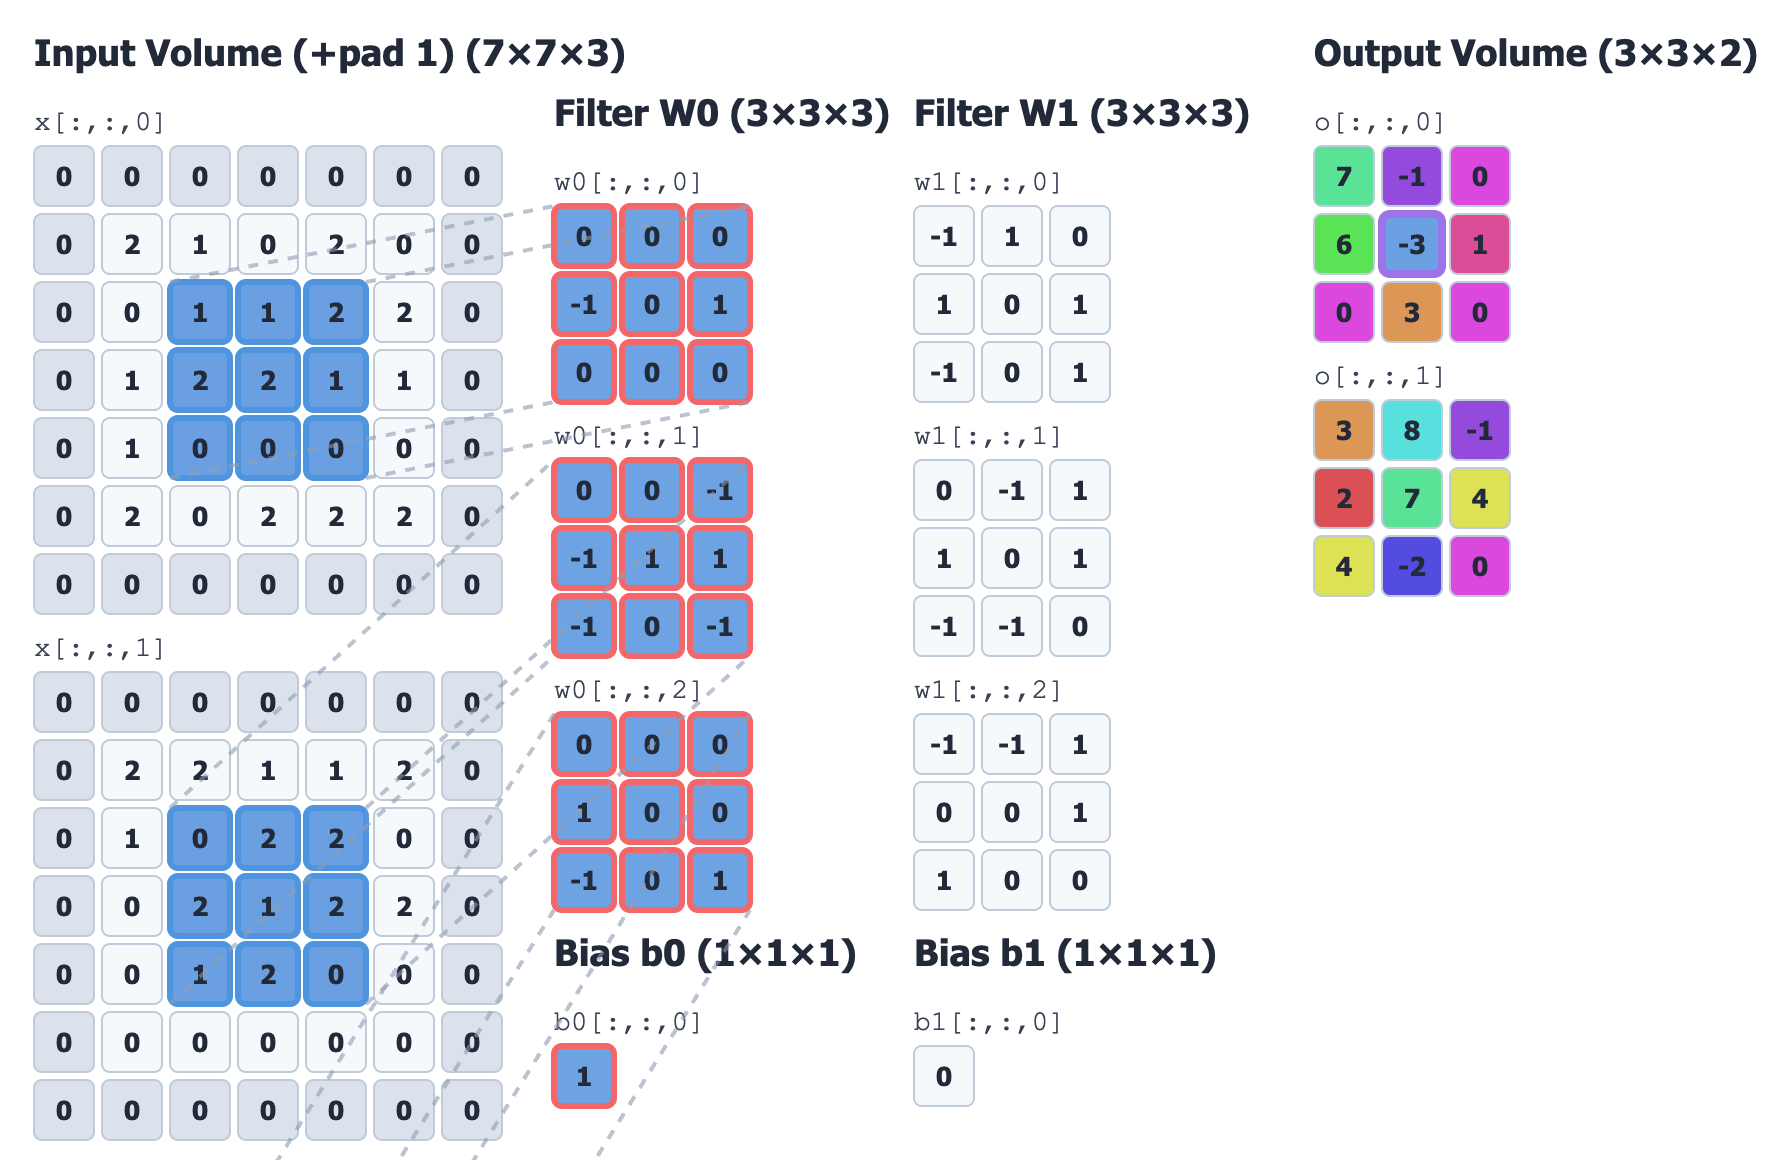
Neural Network Convolution Visualizer
Convolution layer computation