Interactive Simulations
Probability, Statistics, Linear Algebra, and Machine Learning
Interactive Simulations
These interactive simulations help students visualize core ideas in probability, statistics, linear algebra, and machine learning. They are designed for classroom demonstrations, self-study, and exploratory learning.
Use this page as a teaching hub: students can first review the concept in lecture, then open a simulation, change parameters, observe patterns, and connect the visual behavior back to formulas and theory.
Probability Theory
Probability theory becomes more intuitive when students can repeatedly simulate random experiments and compare empirical behavior with theoretical predictions.
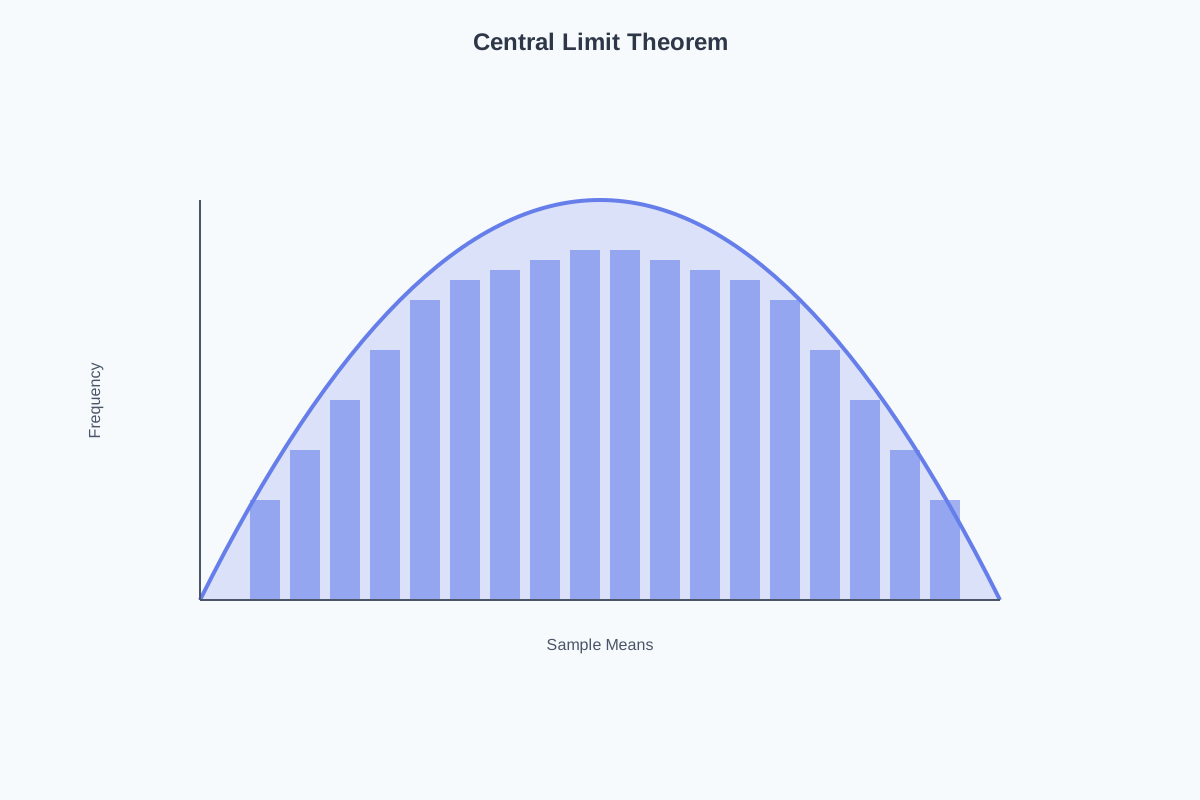
Central Limit Theorem
Explore how the distribution of sample means approaches a normal distribution as the sample size increases, regardless of the original population distribution.
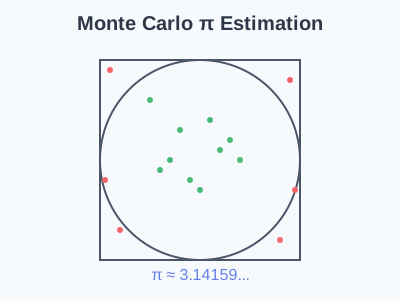
Monte Carlo \(\pi\) Estimation
Use random sampling to estimate \(\pi\) by generating points in a square and counting how many fall inside an inscribed circle.
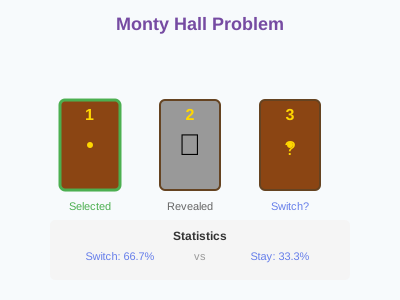
Monty Hall Problem
Test the famous probability puzzle and compare the long-run winning rates for switching versus staying with the original choice.
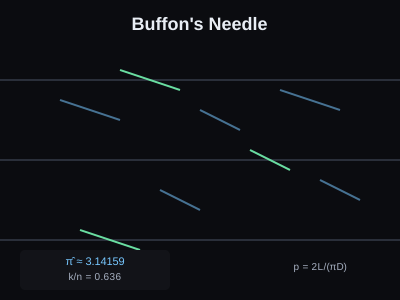
Buffon’s Needle
Estimate \(\pi\) by dropping random needles on parallel lines and observing the crossing frequency.
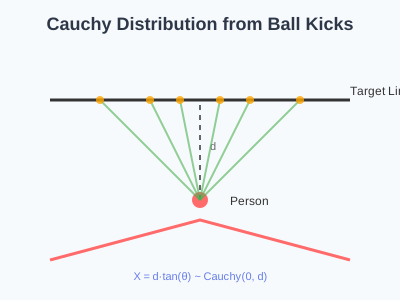
Cauchy Distribution
Visualize how a random angle transformation can produce the heavy-tailed Cauchy distribution.
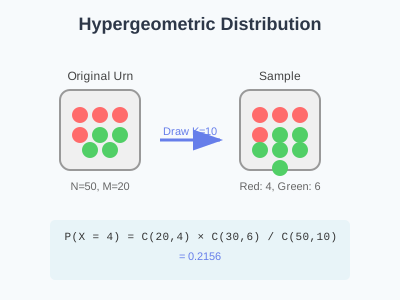
Hypergeometric Urn Experiment
Study sampling without replacement from a finite population and compare simulated outcomes with the hypergeometric distribution.
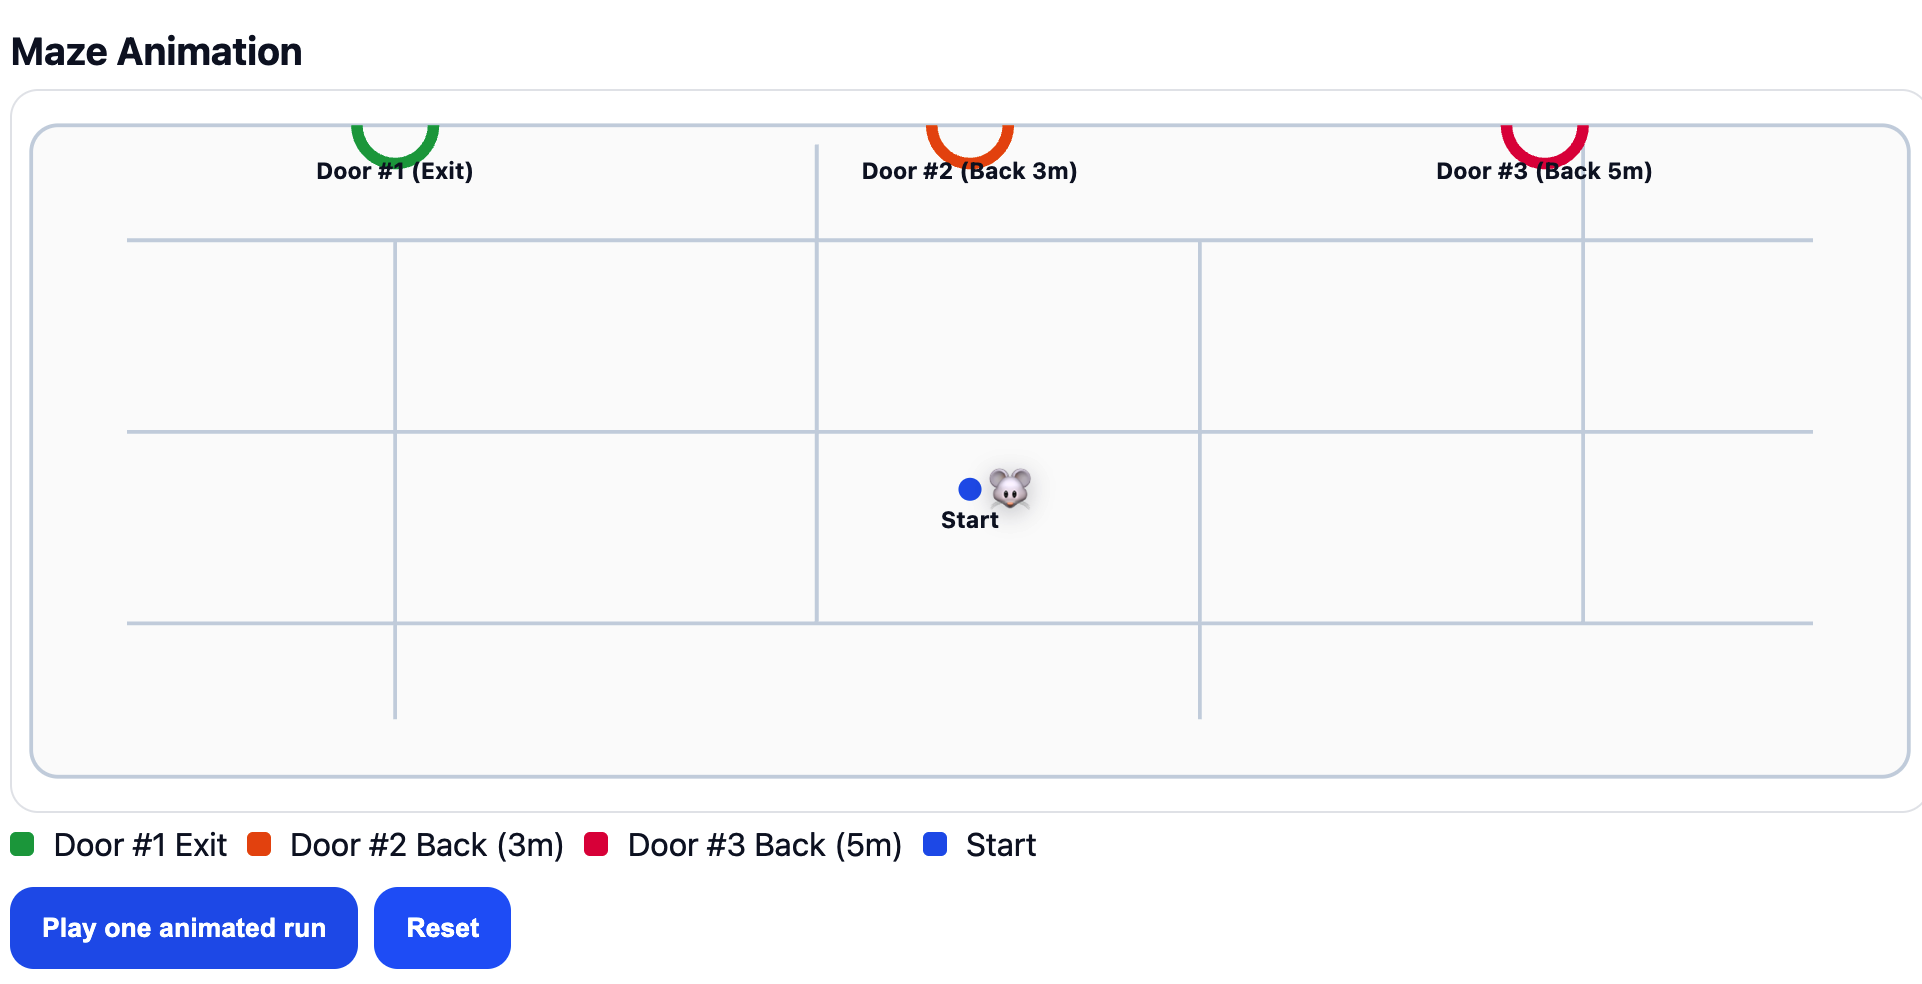
Rat in a Three-Door Maze
Use conditional expectation and Monte Carlo simulation to analyze the expected time for a rat to exit a three-door maze.
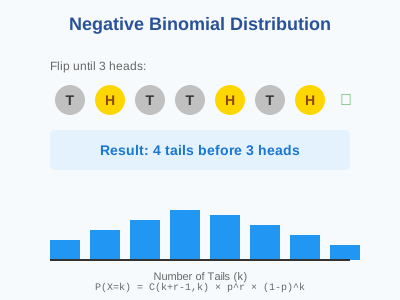
Negative Binomial Simulation
Model the number of failures before reaching a fixed number of successes in independent Bernoulli trials.
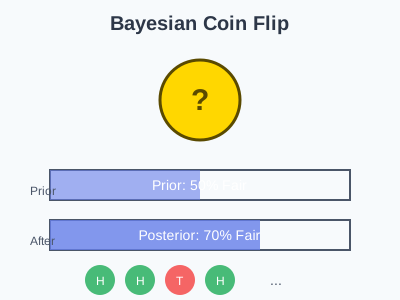
Bayesian Coin Flip
See how Bayesian inference updates beliefs about a coin’s fairness as additional flips are observed.
Statistics
These simulations support statistical reasoning by showing sampling variability, confidence, hypothesis testing, experimental comparison, and model assumptions.
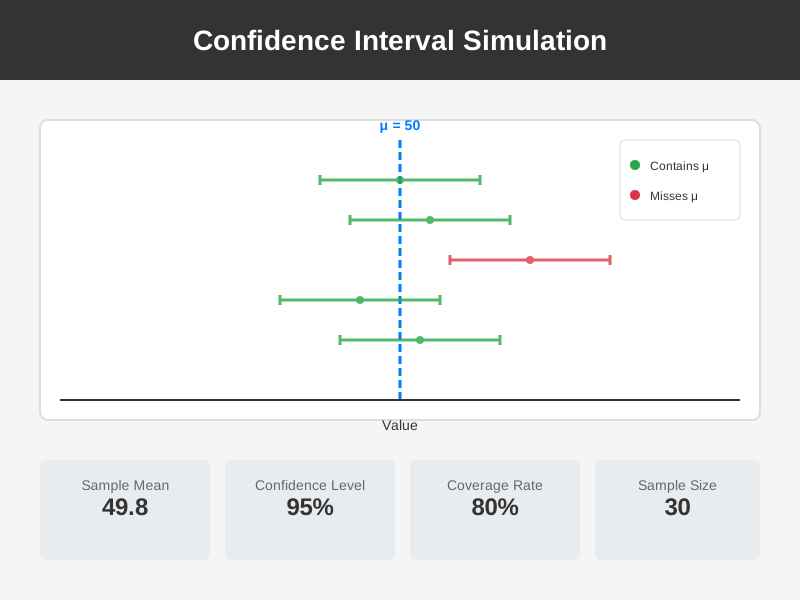
Confidence Interval Simulation
Generate repeated confidence intervals and observe the long-run coverage behavior relative to the true population mean.
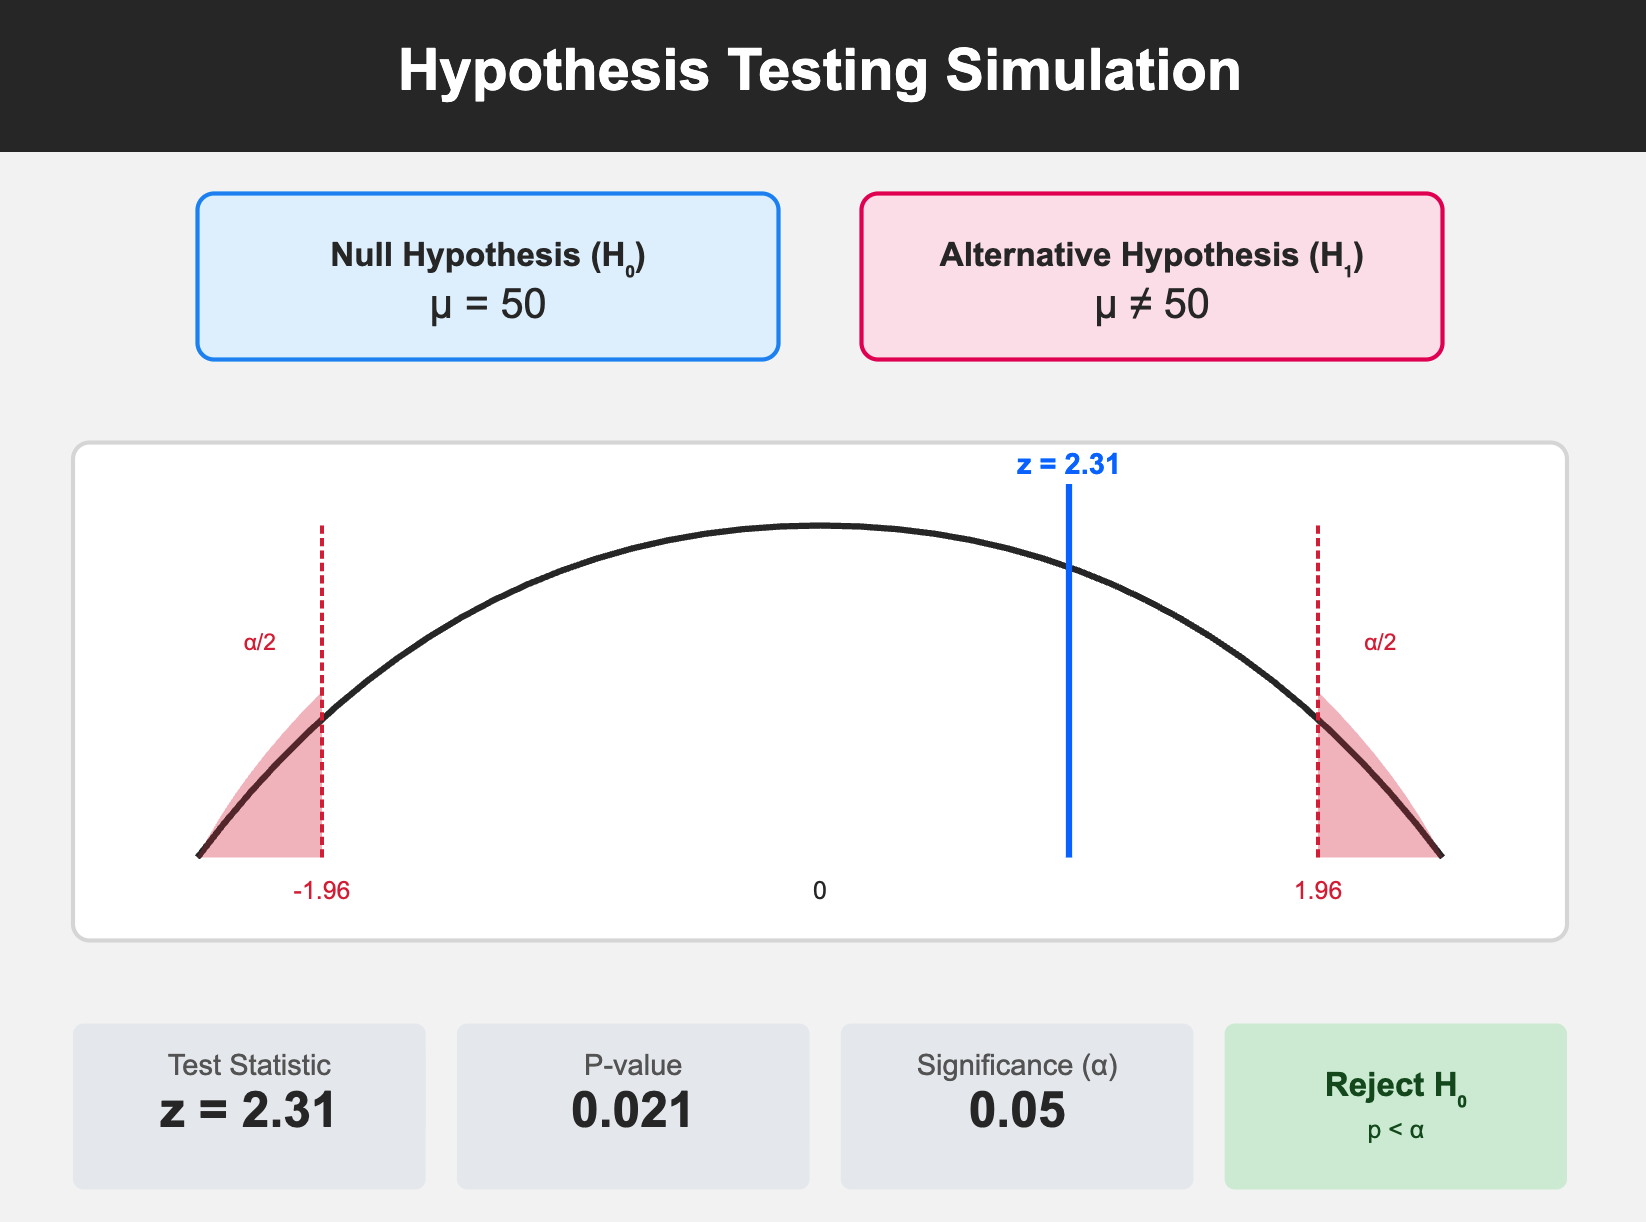
Hypothesis Testing Simulation
Visualize critical regions, test statistics, \(p\)-values, Type I error, Type II error, and power.
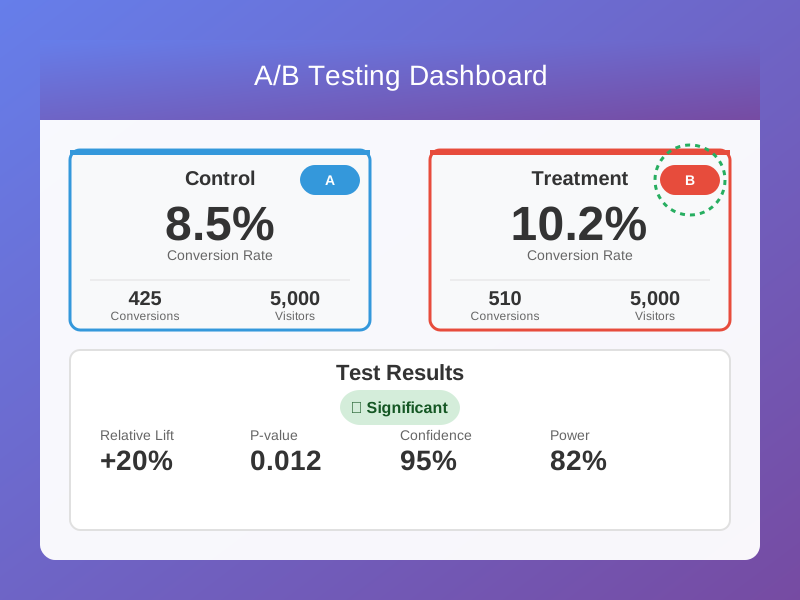
A/B Testing Simulation
Compare control and treatment variants, study lift, confidence intervals, statistical significance, and power analysis.
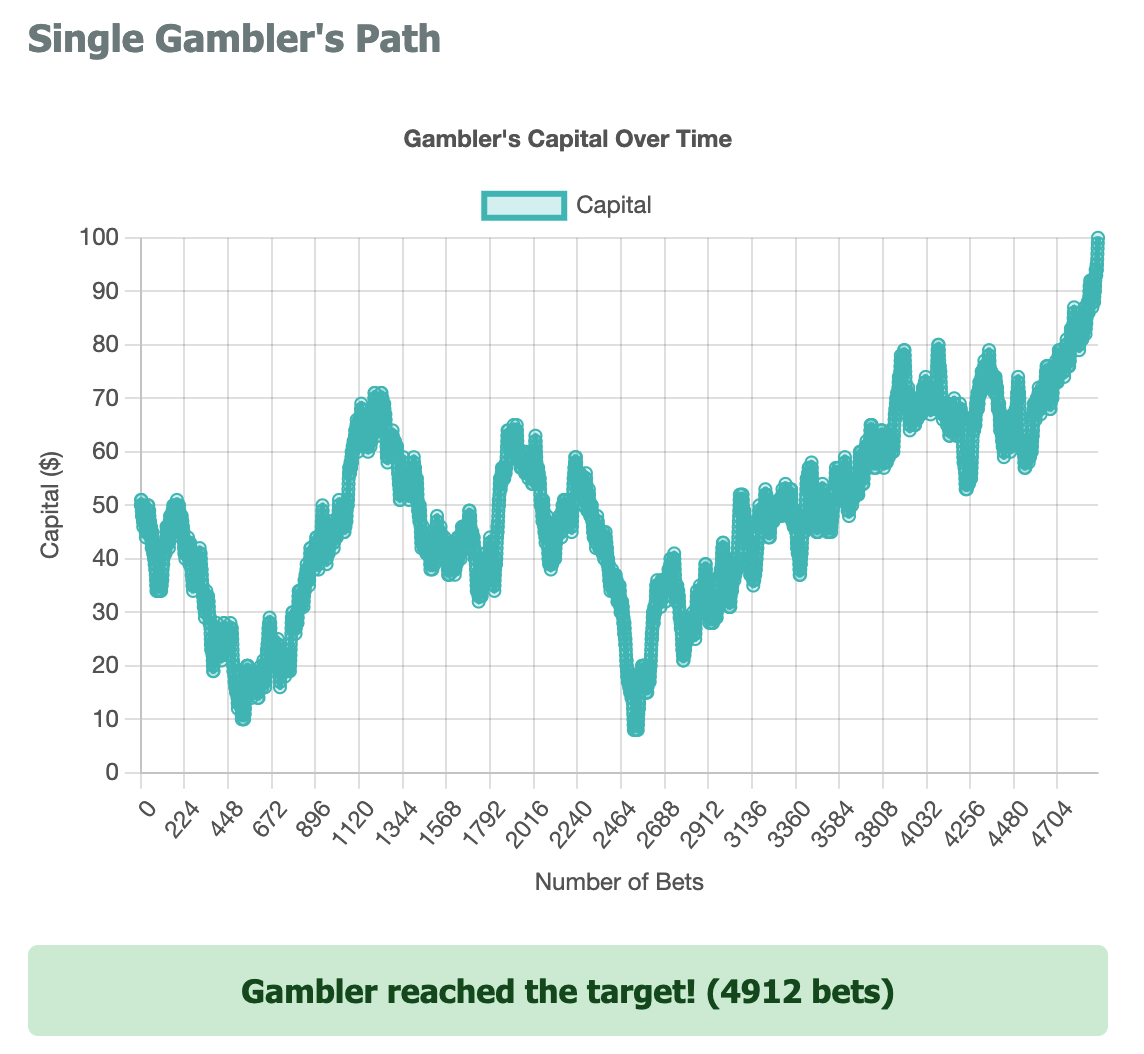
Gambler’s Ruin Problem
Simulate a gambler’s random walk until ruin or success and compare with theoretical absorption probabilities.
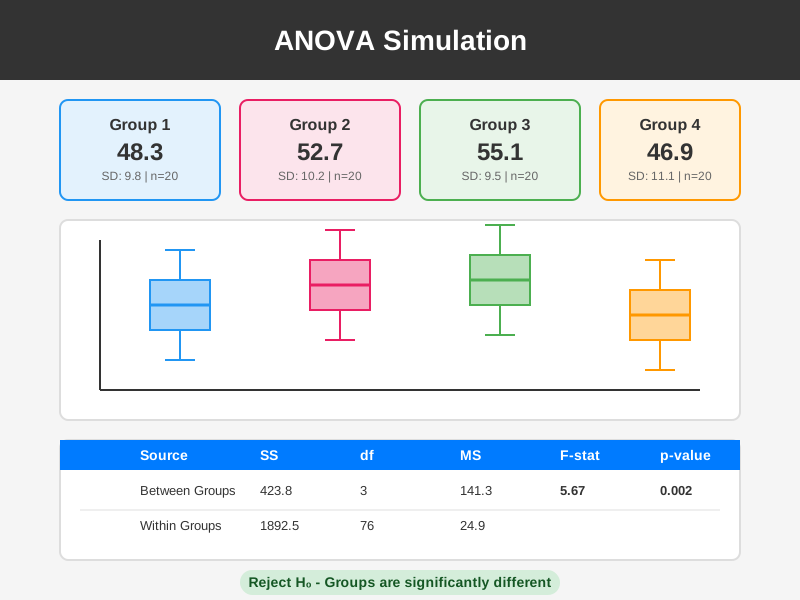
One-Way ANOVA Assumptions
Explore normality, homogeneity of variance, and independence in the context of one-way ANOVA.
ANOVA Simulation
Generate group data, run ANOVA, inspect effect size, and connect between-group and within-group variation.
Linear Algebra
Linear algebra is especially visual: matrices transform geometry, eigenvectors reveal stable directions, singular values organize information, and Markov chains describe long-run structure.
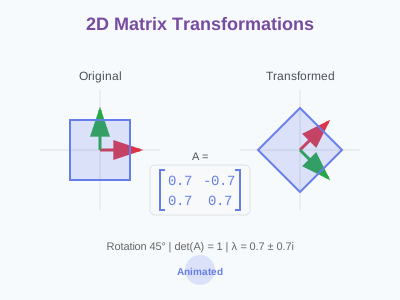
2D Matrix Transformations
Visualize how matrices rotate, scale, shear, reflect, and project shapes in the plane.
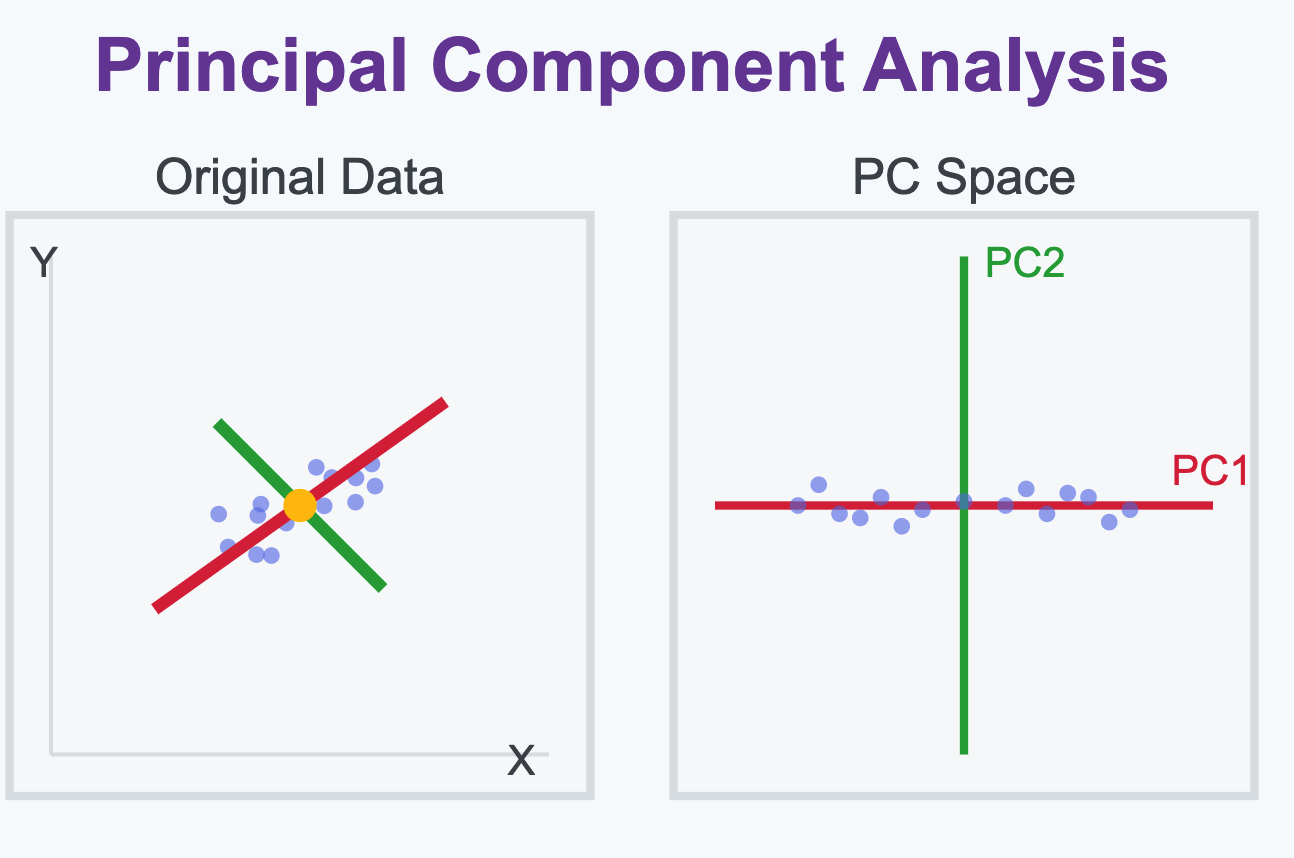
Principal Component Analysis
Generate two-dimensional data, compute principal components, and visualize eigenvectors as directions of maximum variance.
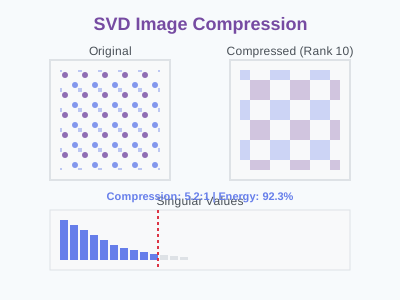
SVD Image Compression
Use singular value decomposition to compress an image and observe the tradeoff between rank, compression, and retained structure.
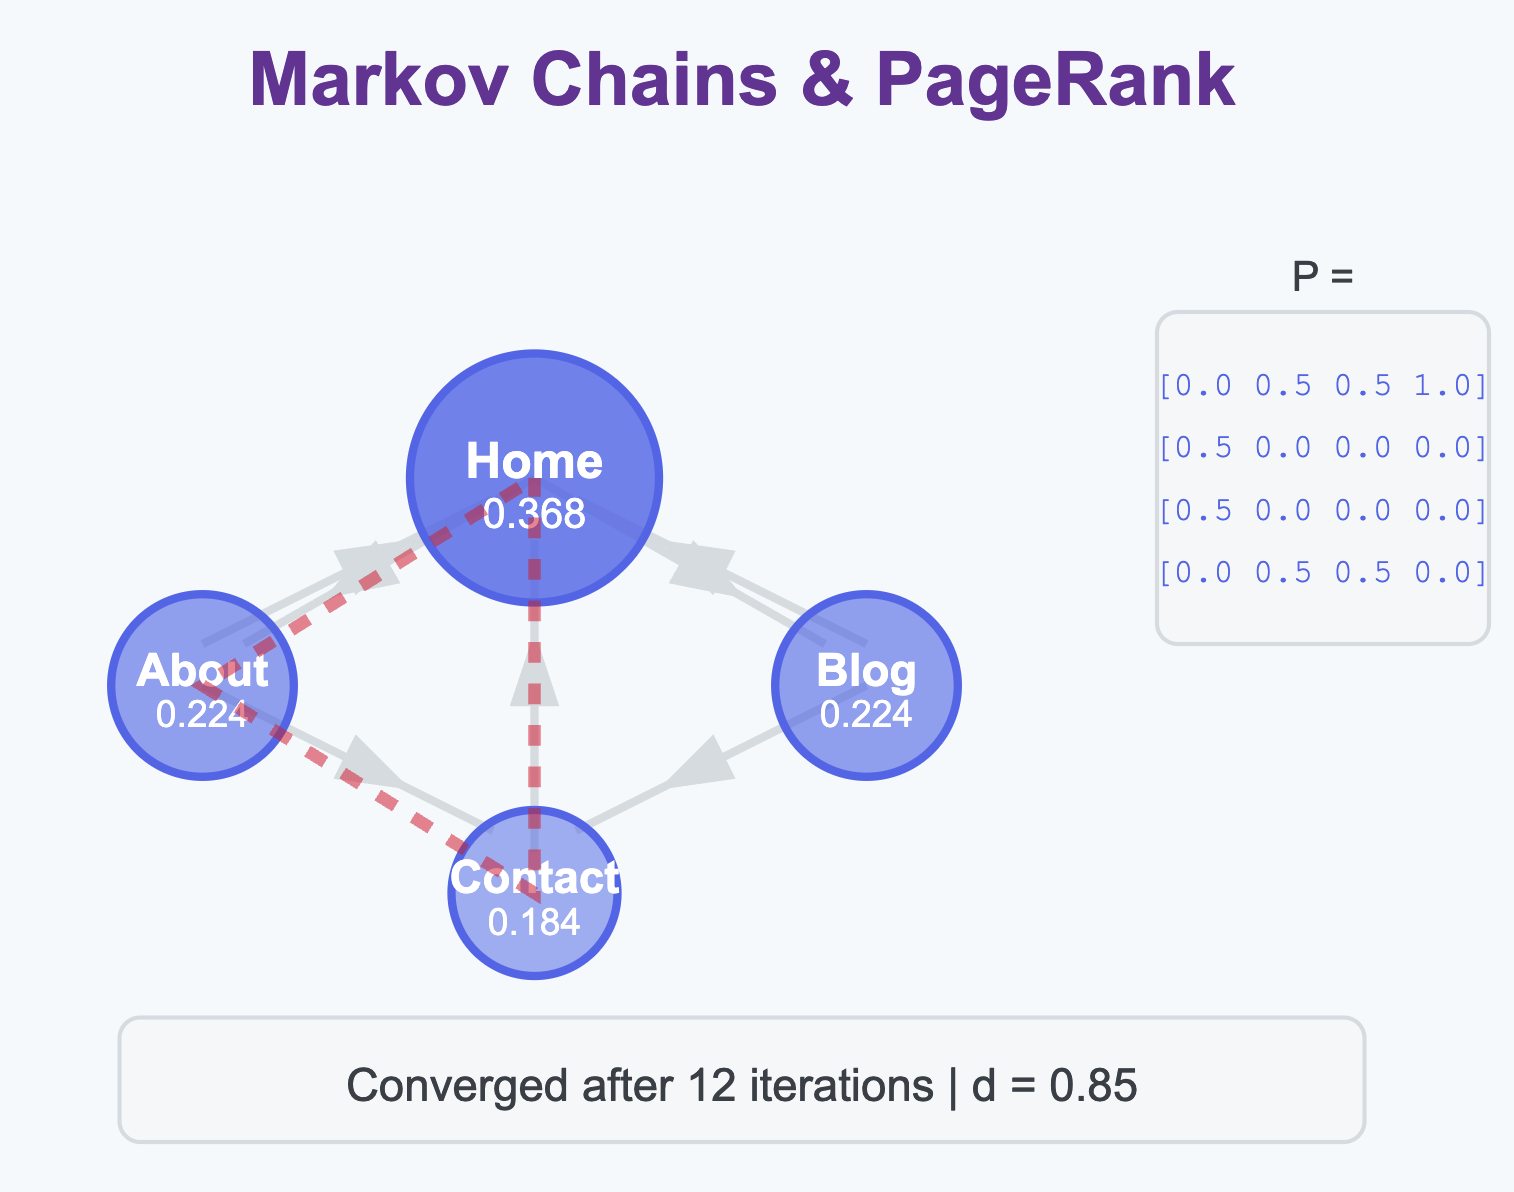
Markov Chains and PageRank
Explore random walks, transition matrices, stationary distributions, and PageRank values on directed graphs.
Machine Learning
These simulations connect algorithms to geometry, optimization, statistical learning, and neural-network computation.
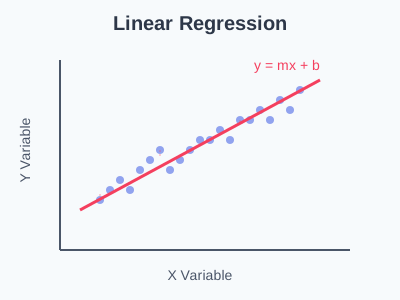
Linear Regression
Generate noisy data, fit a line, and understand residuals, least squares, fitted slope, intercept, and \(R^2\).
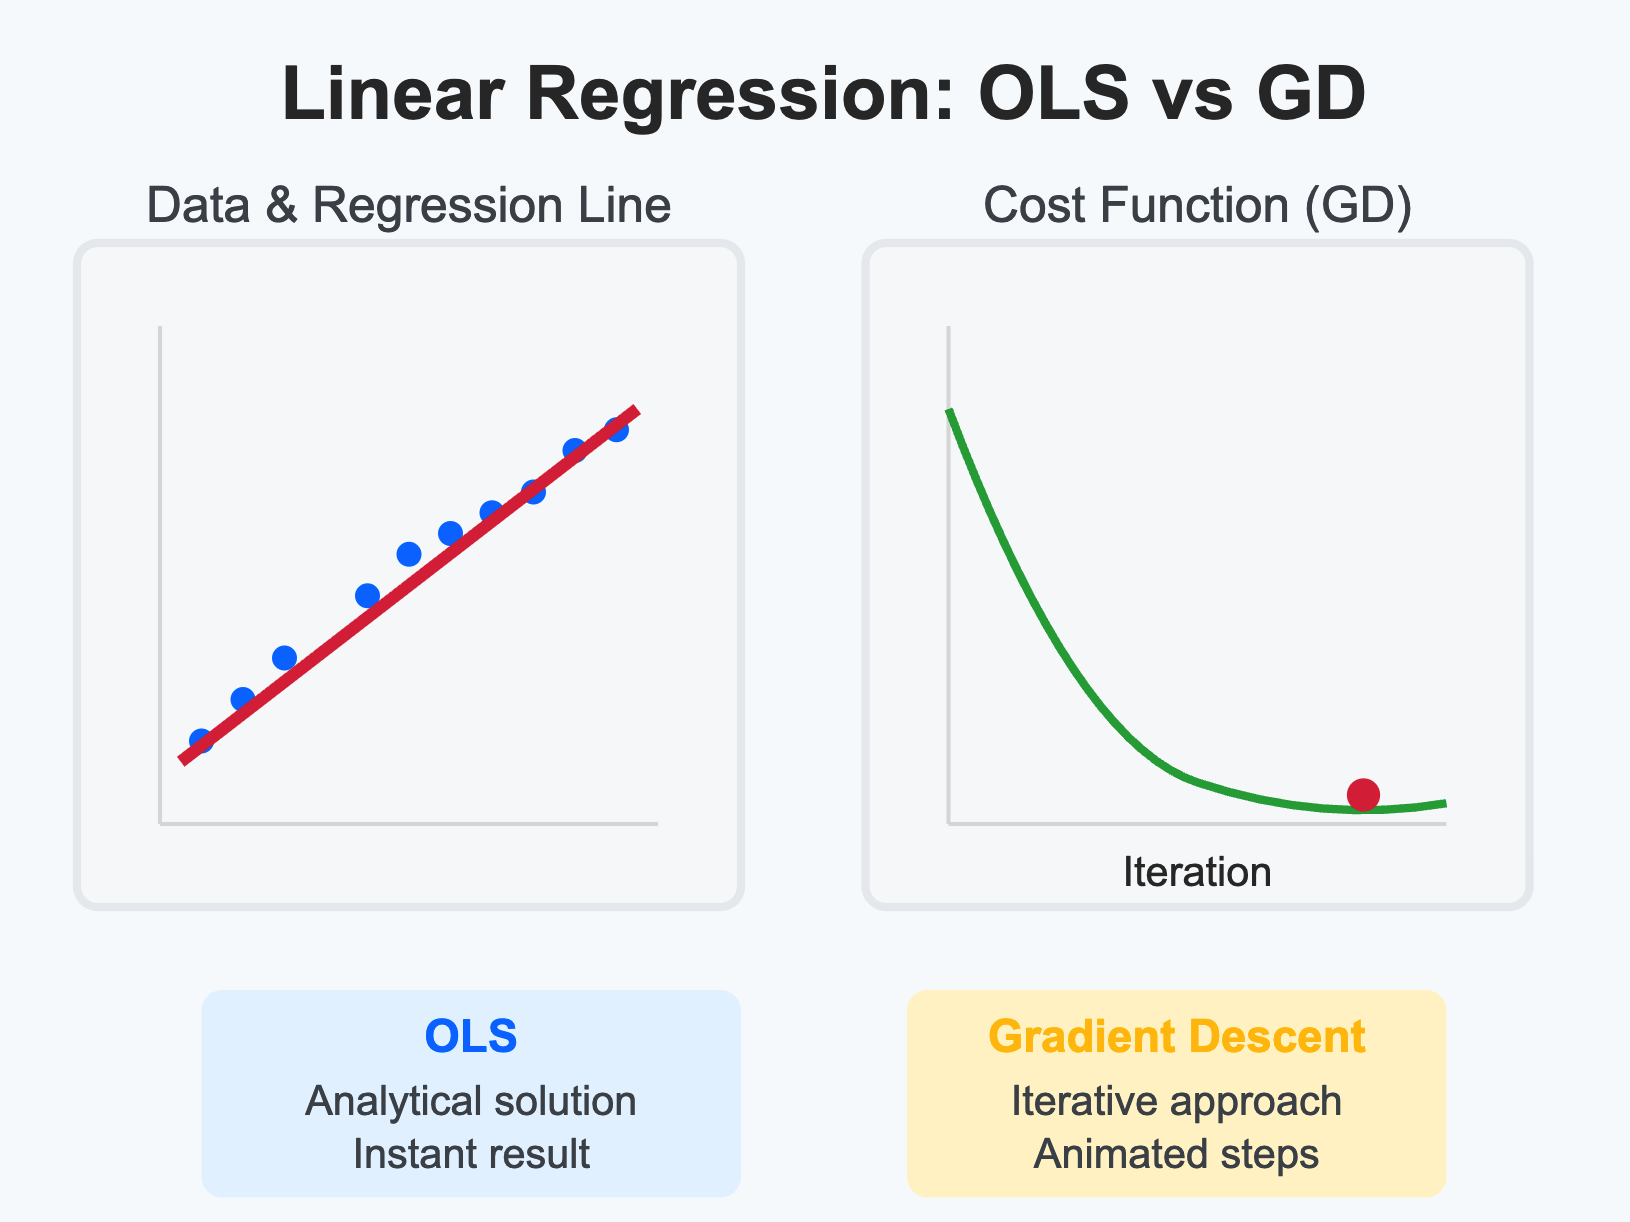
OLS vs Gradient Descent
Compare the closed-form ordinary least squares solution with iterative gradient descent for linear regression.
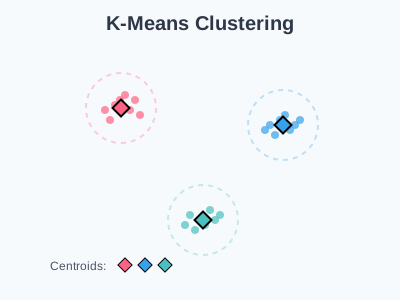
K-Means Clustering
Watch the K-means algorithm iteratively assign points to clusters and update centroids until convergence.
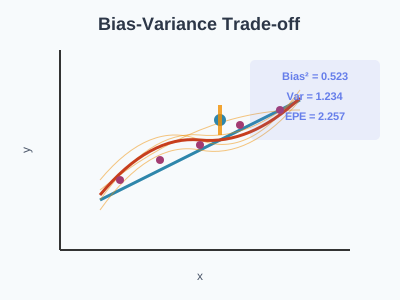
Bias-Variance Tradeoff
Study how model complexity, noise, and sample size affect bias, variance, and prediction error.
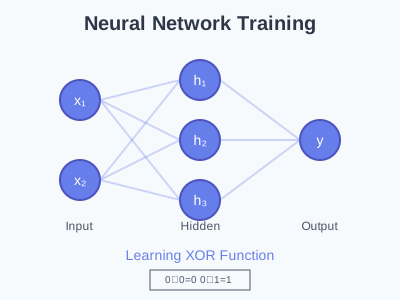
Neural Network Training
Observe a small neural network learn the XOR function through forward propagation, backpropagation, and gradient descent.
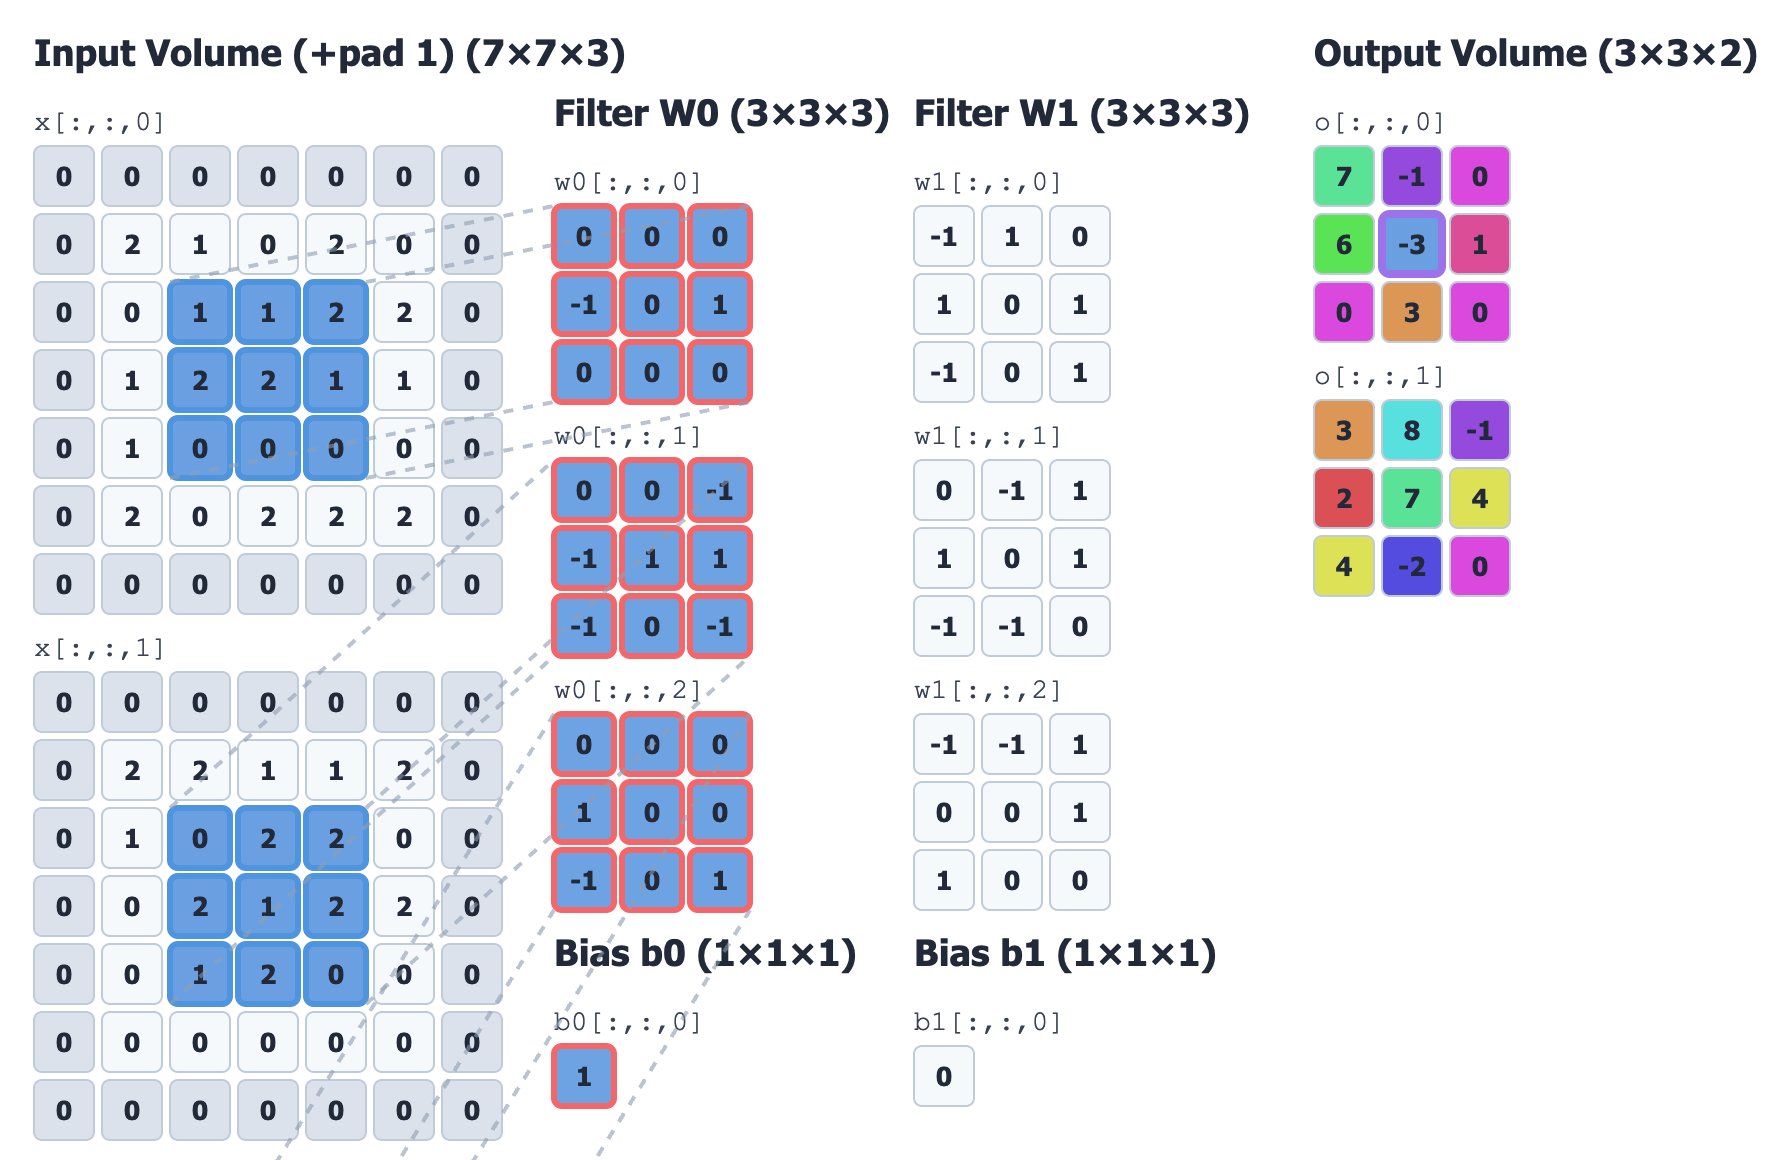
Neural Network Convolution Visualizer
Watch how convolutional filters move across input data and transform it into feature maps.